|

| |
|
Pre-Control -
Statistical Software
$299.95+ S&H
 Pre-Control
Main Screen Pre-Control
Main Screen
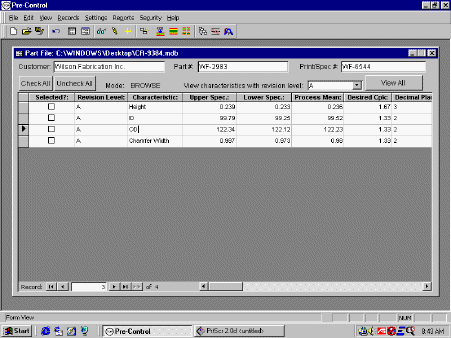
Shown here is a new part file created for part #CR-9384
(shown in the blue title bar)
A part file contains characteristics that will be
controlled using Pre-Control. This part file has four
characteristics
Just enter characteristics and their specifications
Then, check which ones to use to create Pre-Control
charts and click a button to create the charts
Create as many parts files as you need and reopen them at
a later time as needed
|
 Pre-Control
Chart Pre-Control
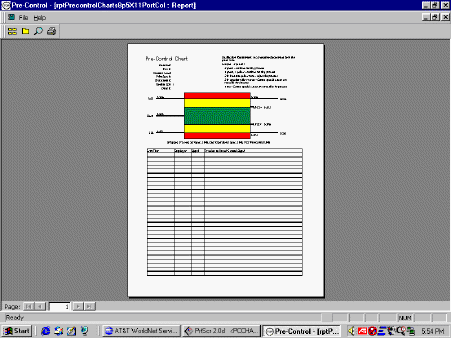
ChartA pre-control chart contains
instructions at the top, the actual pre-control chart, and a table at the
bottom for keeping extremely simple records that prove the process has
been controlled
This is one of many possible formats that can be printed
|
 How
to use a Pre-Control Chart How
to use a Pre-Control ChartThe
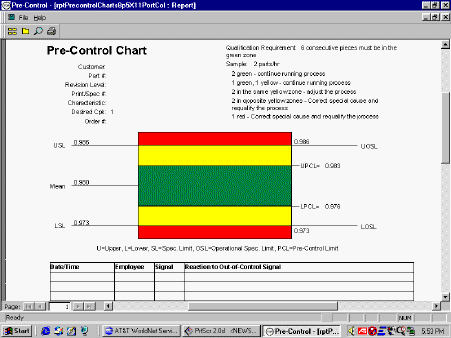
specifications and pre-control limits are displayed on the chart.
Just print this sheet and provide it to the operator.
Operators use the following extremely simple rules when
running a machine or process (these rules are summarized at the top of the
page for the operator):
-First qualify the process by obtaining six consecutive
readings (or pieces) in the green zone. Restart the count if one
falls out of the green zone.
-Once the process is qualified, take a sample of 2
readings (or parts) every hour (sampling frequency will be different for
your process)
-If both readings fall in the green zone, or if one falls
in the green zone and one falls in a yellow zone, then continue running
-If both readings fall in the same yellow zone, then
adjust the process
-If one reading falls in the red zone, or the readings
fall in opposite yellow zones, then stop the process, correct the problem,
and re-qualify the process again with another 6 consecutive green readings
-That's it! That's as complicated as it gets.
(The sampling frequency that you actually will use
depends on how often a pair of yellow readings occurs. The rule
is: Sample 6 times between adjustments. So begin with a rather
frequent sampling interval, and if you discover it normally takes three
hours after one adjustment before another is required, then a sample of
two readings should be taken every 30 minutes. If you can normally
run 6000 pieces between adjustments, then set the new sampling frequency
such that a sample of two readings is taken every 1000 pieces.)
|
| Date/Time |
Employee |
Signal |
Reaction to Out-of-Control Signal |
| 11/6/2000 7:00 am |
JC |
6G |
|
| 11/6/2000 8:00 am |
JC |
GG |
|
| 11/6/2000 9:00 am |
JC |
GG |
|
| 11/6/2000 10:00 am |
JC |
GG |
|
| 11/6/2000 11:00 am |
JC |
GY |
Adjusted Process |
| 11/6/2000 12:00 am |
JC |
GG |
|
| 11/6/2000 1:00 pm |
JC |
GG |
|
| 11/6/2000 2:00 pm |
JC |
Opp YY |
Tightened Loose Fixture |
| 11/6/2000 2:10 pm |
JC |
6G |
|
| 11/6/2000 3:00 pm |
JC |
GG |
|
| 11/6/2000 4:00 pm |
MK |
GG |
|
| 11/6/2000 5:00 pm |
MK |
GG |
|
| 11/6/2000 6:00 pm |
MK |
GG |
|
| 11/6/2000 7:00 pm |
MK |
GG |
|
| 11/6/2000 8:00 pm |
MK |
GR |
Changed tool, sorted parts, 40 pieces
scrapped |
| 11/6/2000 8:15 pm |
MK |
6G |
|
| 11/6/2000 9:00 pm |
MK |
GG |
|
| 11/6/2000 10:00 pm |
MK |
GG |
|
Example: How records can be kept to satisfy
ISO-9000 requirementsIn order
to satisfy IS0-9000 requirements, some kind of a record must be
kept to prove that process control has been maintained. This is one
way to do it. (the Pre-Control software allows many other formats)
The operator simply completes the table under the
pre-control chart, one row at a time, as samples are taken (the operator
usually hand writes the contents of this table - it does not have to be
typed)
Once the operator qualifies the process, they write
"6G" under the signal column (meaning 6 consecutive green
readings)
When a sample of two green readings is taken, the
operator writes "GG" or "2G" under the signal column
If a sample contains a green and a yellow reading, the
operator writes "GY", and indicates that an adjustment has been
made in the "Reaction to Out-of-Control Signal" column.
If a sample contains opposite yellow readings or one red
reading, the operator writes "Opp YY" or "GR" (or
"YR") under the signal column and indicates in the
"Reaction to Out-of-Control Signal" column not only what was
done to fix the process, but what was done to assess potential
nonconforming product that may have been made since the last acceptable
sample.
If a sample contains two yellow readings in the same
zone, the operator would write "Same YY"
When out of room on one sheet, the operator starts a new
sheet. Keep the completed sheets as quality records. (These
sheets take the place of a completed average and range charts and other
similar control charts)
Now isn't this much easier than traditional control
charting methods? Its simplicity makes it possible to teach
even temporary employees how to use pre-control (and how to keep records)
in just a few minutes.
|
 Optionally
Enter Data in Pre-Control Software for Automatic Analysis Optionally
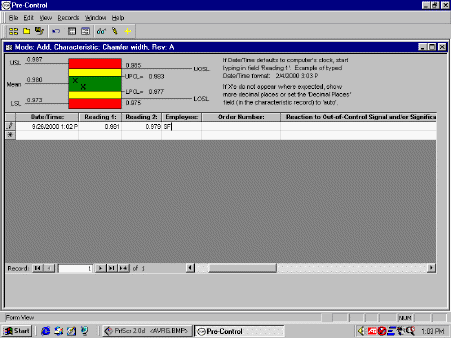
Enter Data in Pre-Control Software for Automatic AnalysisAlthough
the Pre-Control software does not require that data be entered, you may
choose to do so and take advantage of the automatic data analysis
features.
Either copy data that was previously written on printed
pre-control sheets, or enter data directly into the part file as
measurements are taken (if a PC is available where the measurements are
taken)
As data is entered, an 'X' is placed on the pre-control
chart to give a visual indication of the measurement location
Let the Pre-Control software create histograms,
capability analysis, and even traditional control charts (average and
range or individuals and moving range)
|
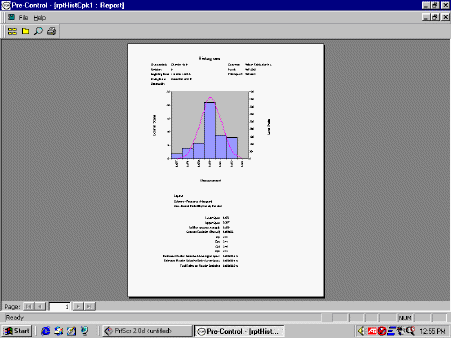 Histogram
and Capability Analysis Histogram
and Capability AnalysisHistograms and
Capability Analysis are shown together on the same page
The capability analysis (on the lower half of the page)
reports Cp, Cpu, Cpl, Cpk, and estimated fraction defective
Print histograms for data within a specified date range
and/or for a specific order#, work order#, job#, etc.
|
Mens Miami Dolphins '47 Brand Khaki Clean Up Visor,Men's Green Bay Packers G-III Sports by Carl Banks Green Packable Polyfill Full-Zip Jacket,Women's New York Giants Concepts Sport Royal Fa?ade Union Suit Pajamas.Men's Cincinnati Bengals G-III Sports by Carl Banks Black Defense Pleather Varsity Jacket,Denver Broncos Tervis 16oz Cheap Orange Cleveland Browns Jerseys. Bubble Wrap Tumbler.Mens Nike Franco Harris Black Pittsburgh Steelers Retired Player Limited Jersey,Women's Green Bay Packers Boa Scarf,'47 Brand New York Giants Franchise Sophomore Fitted Hat - Red/Royal Blue Nike Cleveland Browns Youth Jerseys.Mens Arizona Cardinals Charcoal Big & Tall Classic Fleece Pants,Women's Baltimore Ravens Ray Lewis Nike Purple Limited Jersey -,Men's Baltimore Ravens G-III Sports by Carl Banks Black On The Fifty Head to Head Super Bowl XLVII Championship Helmet Tri-Blend T-Shirt.Men's Chicago Bears New Era Navy/Gold Gold Collection Original Fit 9FIFTY Snapback Adjustable Hat,Mens Baltimore Ravens Terrell Suggs Nike Purple Game Jersey,Nike Jay Cutler Chicago Bears Youth Throwback Game Jersey - Navy Blue Cleveland Browns Introduction History.Chicago Bears Preschool Contrast Stripe Midweight Full Zip Jacket - Navy Blue,Infant Washington Redskins Burgundy My First Cap Stretch Hat,Men's Oakland Raiders The Northwest Company Beaded Neck Pillow.New England Patriots Chevron Drawstring Backpack,Pro Line Houston Texans Heritage Football Jersey Long Sleeve T-Shirt - Navy Blue Cleveland Browns History.New York Jets Laptop Carry Case,Women's Houston Texans Shatter Tote Bag
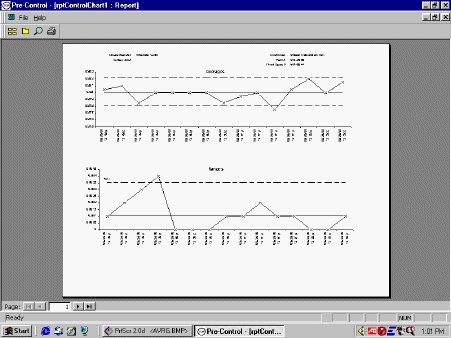 Traditional
Control Charts Traditional
Control ChartsPrint traditional control
charts (average and range charts or individuals and moving range
charts)
These are not used for real-time control - pre-control
charts take care of that. However, traditional control charts may
still be necessary to prove the process is stable (a requirement for
calculating Cpk), or for helping to diagnose a process
problem.
The traditional control chart (if used) with pre-control
would typically be printed and interpreted after the process has completed
(usually by someone knowledgeable with interpreting traditional control
charts). Thus, the average operator does not
have to be trained in traditional control charts, only on the simple
pre-control method.
|
|
